
2024 USACE DEIS Maps
Click below to view an interactive map of the Pearl River Flood Risk Management Alternatives. (requires desktop or laptop viewing)
**Pearl Riverkeeper created this map FOR INFORMATIONAL PURPOSES ONLY to allow citizens to explore the Pearl River Flood Risk Management (FRM) project area and project Alternatives. The information on this map was pulled from the 2018 Section 211 Draft Environmental Impact Statement (DEIS), the 2024 USACE Pearl River FRM DEIS, and other local mapping. THIS MAP PROVIDES APPROXIMATE LOCATIONS AND SHOULD NOT BE USED FOR PLANNING, DECISION-MAKING, LEGAL, ENGINEERING, OR SURVEYING PURPOSES.
**Pearl Riverkeeper created this map FOR INFORMATIONAL PURPOSES ONLY to allow citizens to explore the Pearl River Flood Risk Management (FRM) project area and project Alternatives. The information on this map was pulled from the 2018 Section 211 Draft Environmental Impact Statement (DEIS), the 2024 USACE Pearl River FRM DEIS, and other local mapping. THIS MAP PROVIDES APPROXIMATE LOCATIONS AND SHOULD NOT BE USED FOR PLANNING, DECISION-MAKING, LEGAL, ENGINEERING, OR SURVEYING PURPOSES.
Utilize the menu on the bottom of the map to view a Map Legend and Map Layers. Layers may be turned on and off. Layers include: Draft Alternative A1 (2023), Alternative A1, Alternative D, Alternative D Footprint, Alternative C Footprint, Canton Club Levee, River Mile Markers, Hazardous Toxic Sites, Fannye Cook Natural Area, Jackson Metro Levees, 34/36/38 ft Flood Extents, USA Flood Hazard Map, and Justice 40 Tracts. Click on portions of the map for more information about each layer.
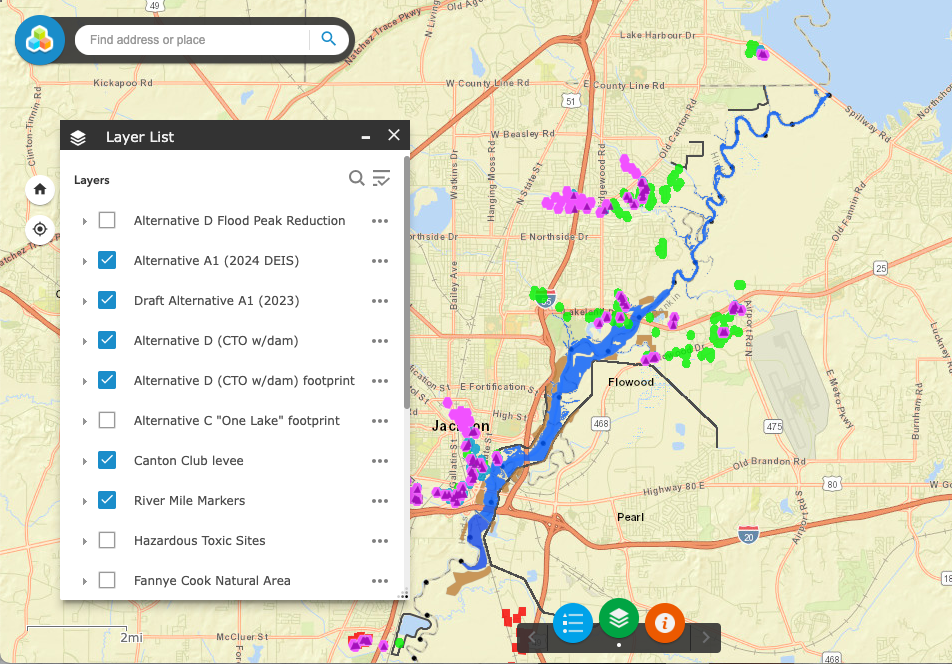
Click to view Interactive Map
Maps, 2024 USACE DEIS, Main Report
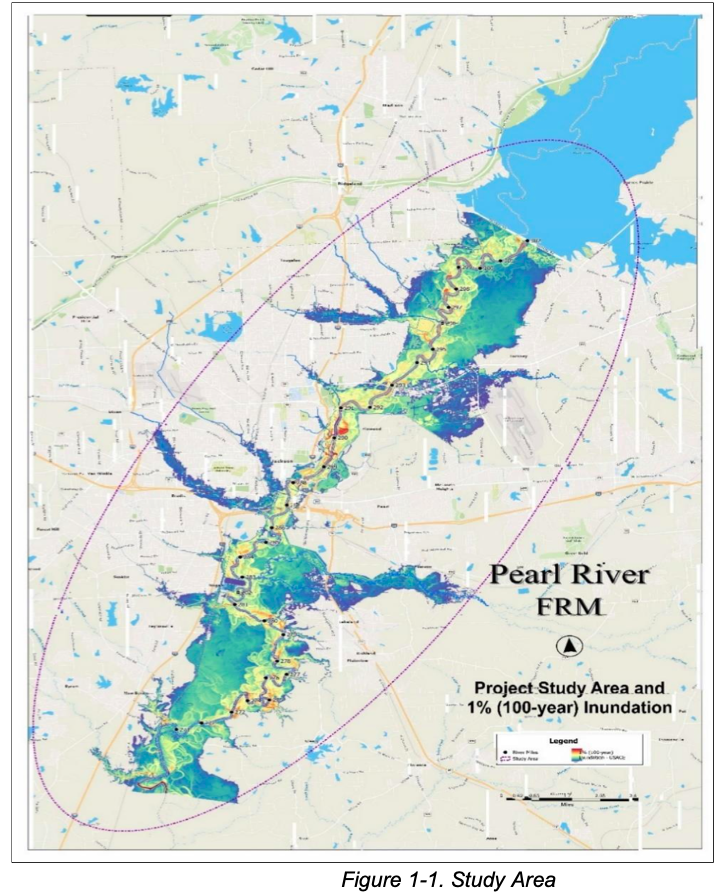
Pearl River Flood Risk Management (FRM) Study Area and 1% (100-year) Inundation, PDF page 27
PDF page 57
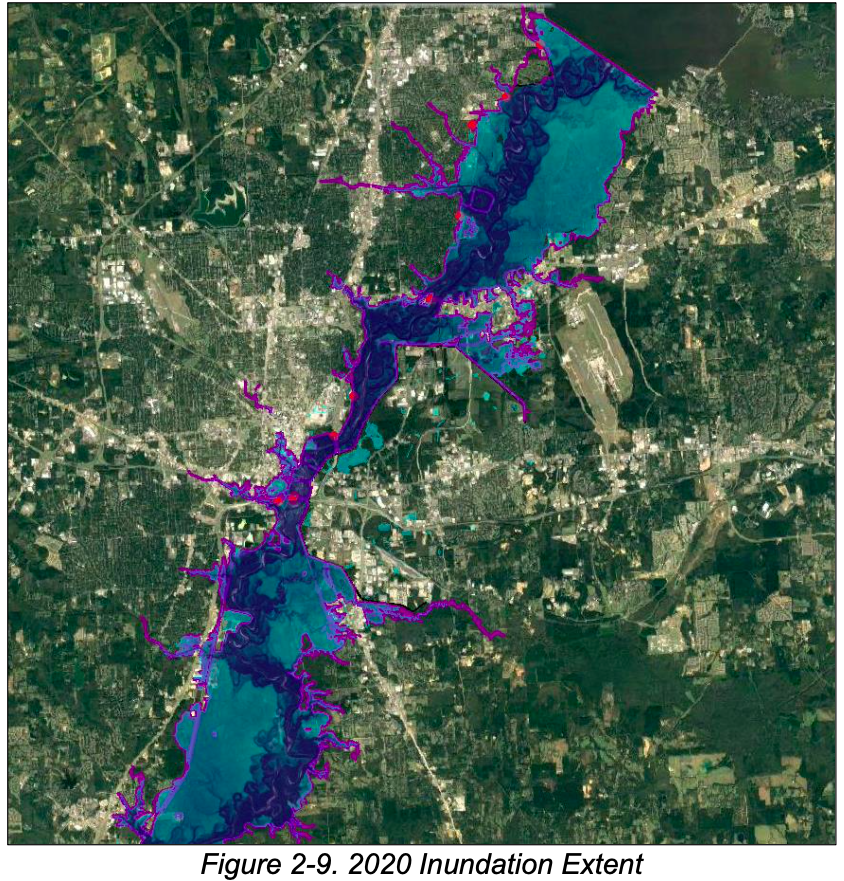
"The river crested at 36.7 feet at the Jackson Gage on February 17, 2020, and was the third highest crest of the gage’s period of record (Figure 2-9). Roughly 120 homes and businesses were damaged from the flood, and many more businesses and homes were temporarily inaccessible due to roadway overtopping. No levees were overtopped during this event." (PDF page 56). Areas north of Lakeland Drive experienced more flooding than expected with a 38 feet river stage, while areas south of Lakeland Drive, particularly in downtown Jackson, experienced flood patterns more typical of previous events. (National Weather Service, Jackson)
PDF page 121
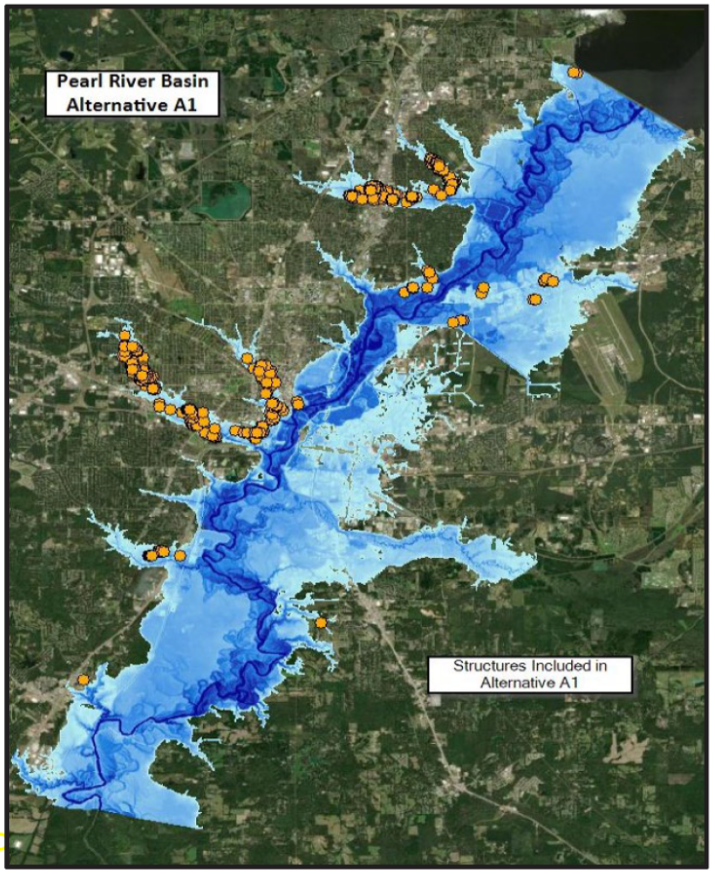
The Alternative A1 nonstructural plan analysis was based on an inventory of residential and non-residential structures. An assessment of structures located in the 10%, 4%, 2%, and 1% floodplains was performed for the portions of the study area subject to flooding from the main stem of the Pearl River and backwater flooding on the tributaries. (PDF page 118-119) Based on this incremental floodplain analysis, approximately 143 structures, 81 residential and 62 nonresidential, were included in the nonstructural plan referred to as Alternative A1.
PDF page 144
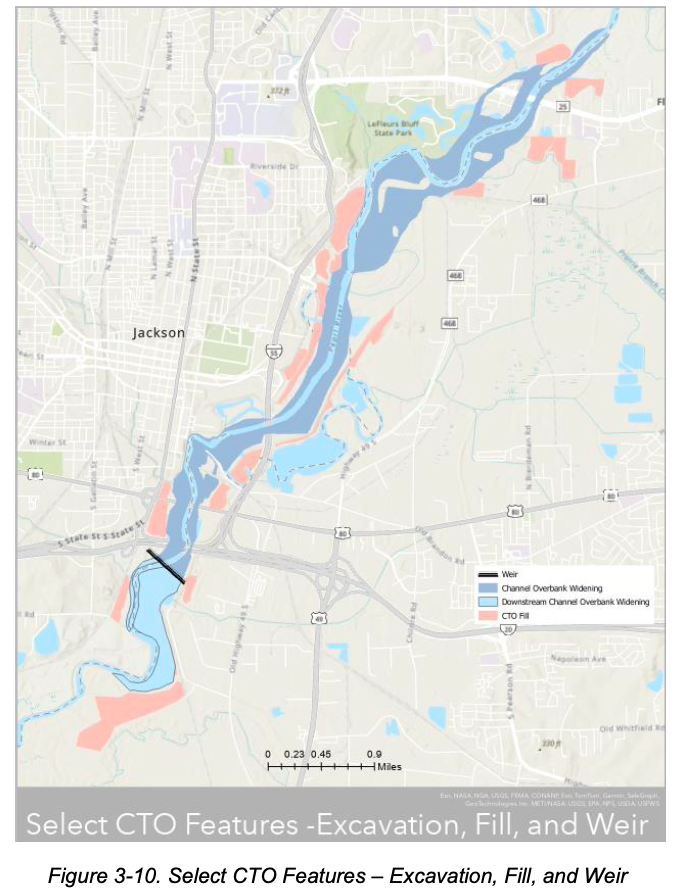
Alternative CTO consists of the construction of channel improvements, along with a new weir (Alternative D). "Flood risk management is realized through lowering of the channel overbanks within the project footprint, thereby improving conveyance of water through the project area and lowering the water surface elevation of the river in some places within the project area over 4 feet (1.2 m). Water surface elevation reductions due to this excavation would provide reduction of flood elevations not only within the reach of excavation, but additional elevation reductions upstream for over 8 miles upstream of the excavation limits." (PDF page 143)
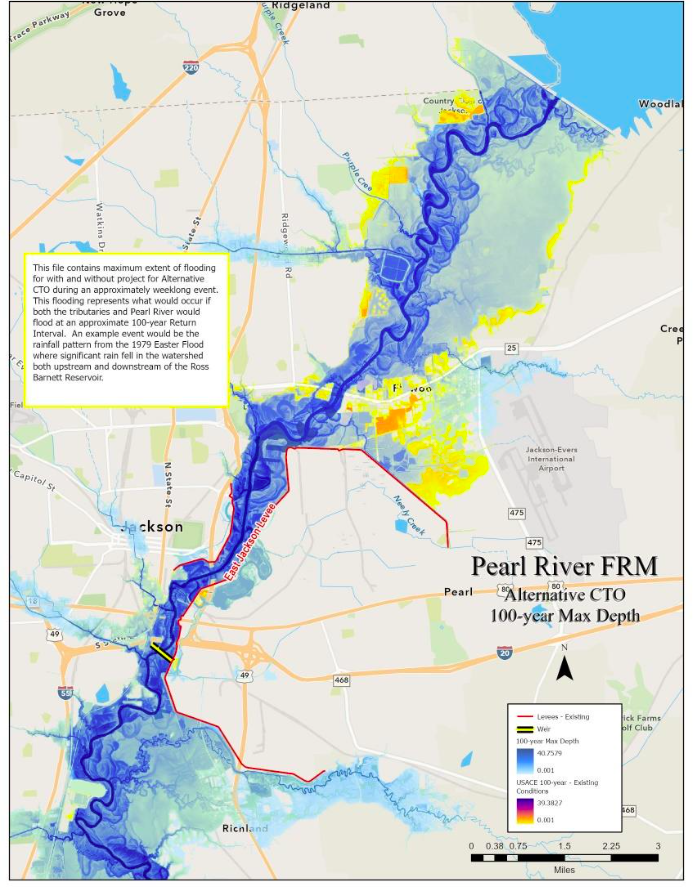
Figure 4-2, Alternative CTO 100-year Flood Extent Reduction (Tributary and Pearl River Impacts), PDF page 197
This map shows maximum extent of flooding for with and without project for Alternative CTO during an approximately weeklong event. This flooding represents what would occur if both the tributaries and Pearl River would flood at an approximate 1% (100-year) flood. An example event would be the rainfall pattern from the 1979 Easter Flood where significant rain fell in the watershed both upstream and downstream of the Ross Barnett Reservoir. Yellow and orange colors shows areas with flood reduction and blue colors show areas that would still be inundated. Areas with low income and/or minority population are still experiencing flooding, however, these flooding areas are reduced in comparison to Alternative C "One Lake". (PDF page 196) *Note the extensive tributary flooding.
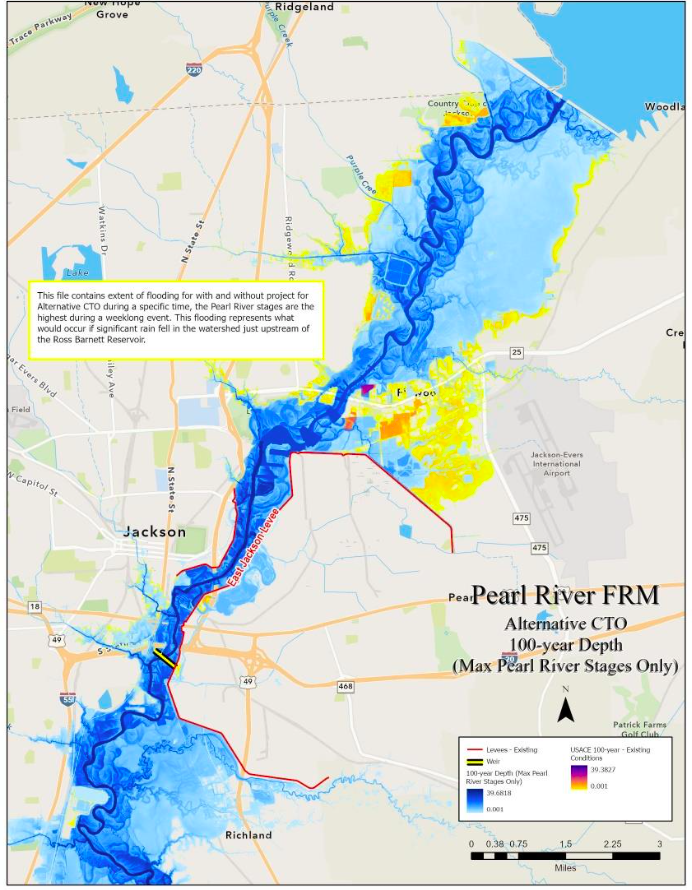
Figure 4-3, Alternative CTO 100-year Flood Extent Reduction (Pearl River Impacts Only), PDF page 197
This map shows maximum extent of flooding for with and without project for Alternative CTO during an approximately weeklong event if significant rain fell in the watershed only upstream of the Ross Barnett Reservoir. Yellow and orange colors shows areas with flood reduction and blue colors show areas that would still be inundated. Areas with low income and/or minority population are still experiencing flooding, however, these flooding areas are reduced in comparison to Alternative C "One Lake". (PDF page 196)
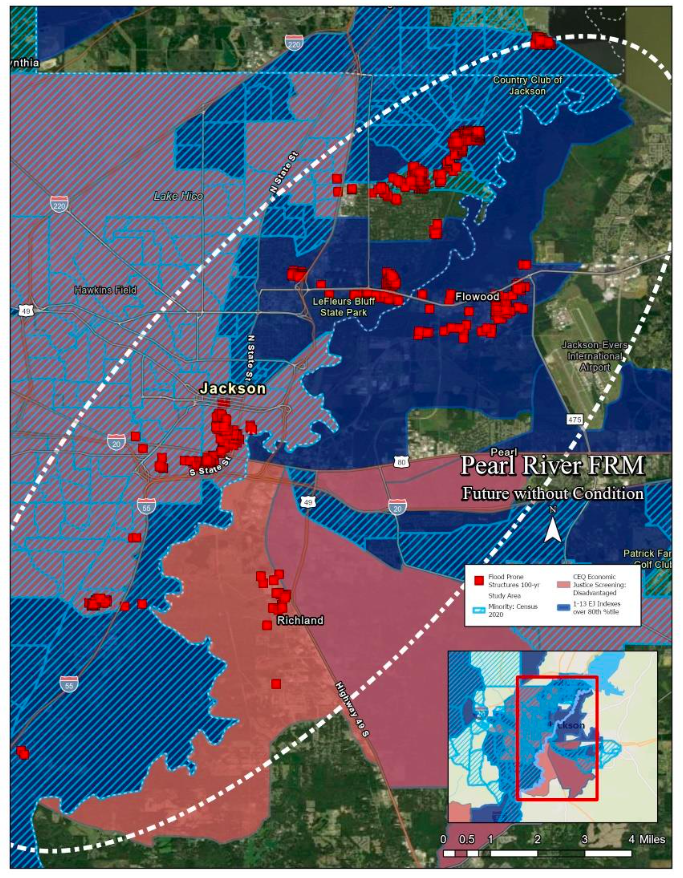
Figure 4-8, Future Without-Project Condition, Structures in the 100-year floodplain and areas of EJ concern, PDF p 235
Figure 4-8 shows the structures in the study area that flood at the first floor, for the cumulative 1% (100-year) floodplain. About 773 structures in the study area are part of the approximate 1% (100-year) floodplain. All 773 structures are located in areas of Environmental Justice (EJ) concern. Colored polygons represent areas of EJ Concern, either an area identified as a federally-designated "disadvantaged community" (red), or as a "majority minority" area (blue hashed polygons), or both (purple), or an area meeting the EJSCREEN EJ indexes percentile criteria (dark blue area). The red squares represent structures flooding. (PDF page 235)
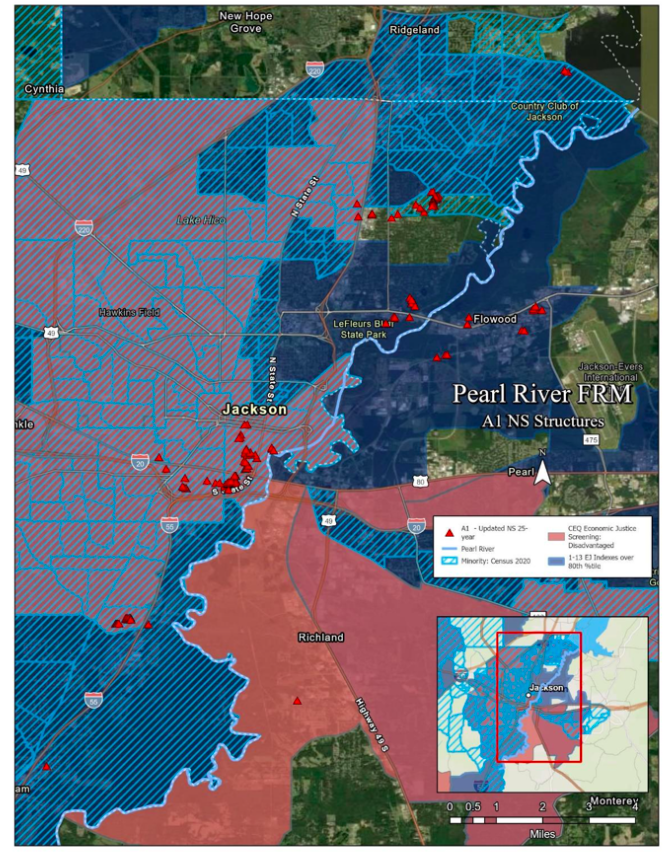
Figure 4-9, Non Structural (Alternative A1), PDF page 237
About 143 structures, 81 residential and 62 nonresidential, out of the approximately 773 structures in the cumulative 1% (100-year) floodplain are part of the nonstructural plan. "Homeowners of eligible residential properties can volunteer to have their home elevated, but also have the choice to participate in the voluntary buyout program. Owners of non-residential structures could be eligible for floodproofing of their structure." (PDF page 236)
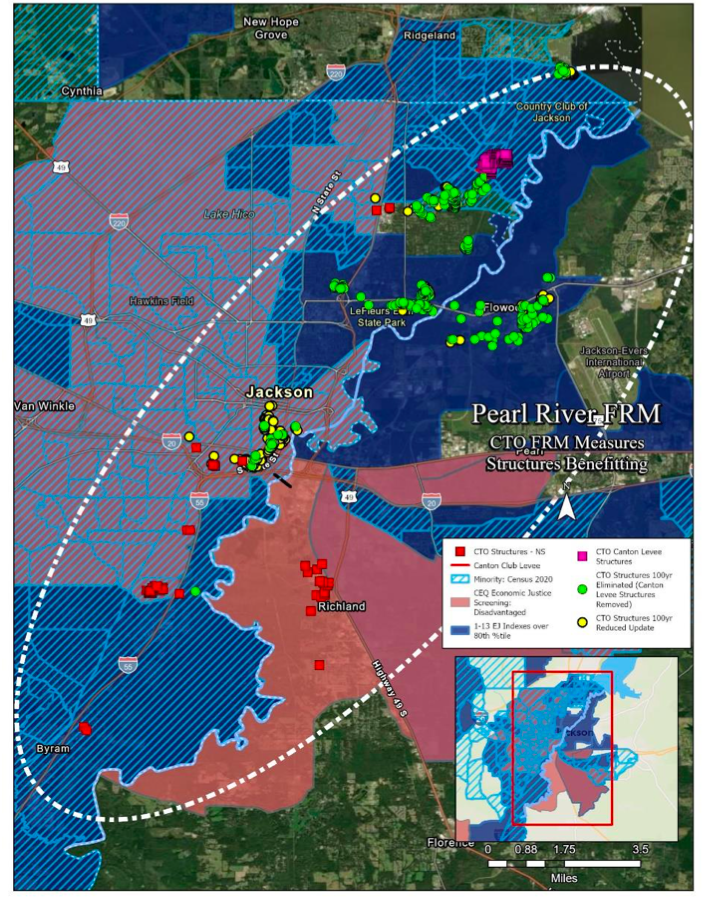
Figure 4-11, Structures Benefiting from Alternative CTO and Areas of EJ Concern, PDF page 242
Construction of channel improvements could benefit 548 structures in the 1% (100-year) floodplain. "Figure 4-11 shows the location of the structures that could benefit from channel improvements, either by flooding less (yellow circles), or no longer flooding at all (green circles). Of the 548 structures benefiting from the FRM channel improvement, a majority 316 structures are no longer flooding from a 1% (100-year) event. Another 232 structures would benefit from a lowering of the flood stage and would continue to flood but less with the channel improvement constructed." (PDF page 242-243)
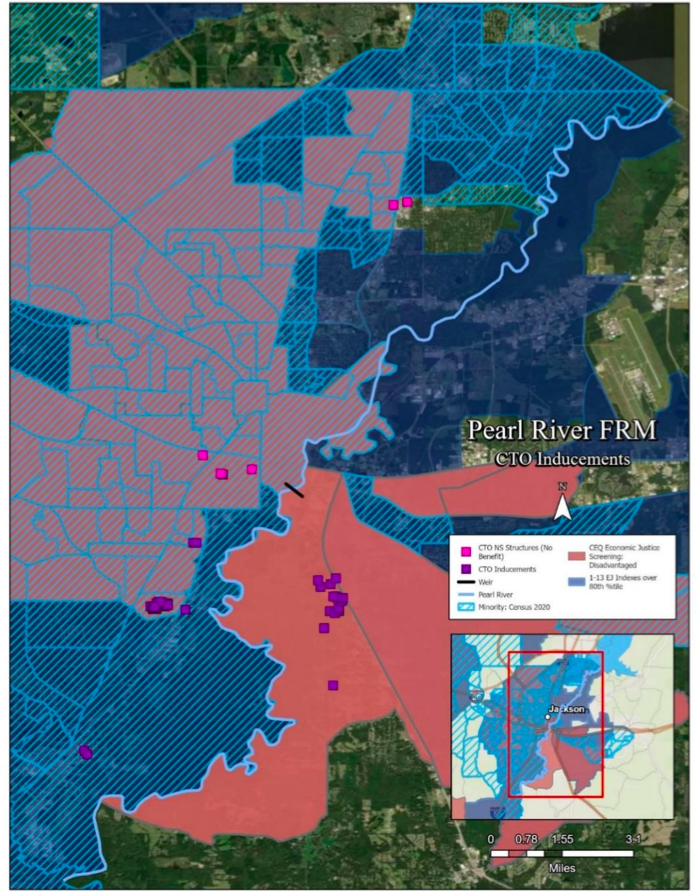
Figure 4-13, CTO Flooding Inducements, PDF p 247
"Direct, adverse impacts from construction of Alternative CTO include potential induced flooding from the 100-year storm event to approximately 52 structures in the study area. Figure 4-13 shows the location of 52 structures (purple squares) that could have induced flooding from Alternative CTO. These structures could experience more flooding if Alternative CTO is constructed than they would experience if Alternative CTO was not constructed. The structures shown as the color pink squares are those that the CTO alternative does not provide any Flood Risk Management benefit (either a lowering of flood stage or no longer flooding). All of the 60 structures are in areas of EJ (Environmental Justice) concern." The structures that will experience induced flooding are located south of I-20, in South Jackson (Ward 7) and Richland. The owners of the structures that will experience flooding caused by Alternative CTO, and the 8 structures not benefiting from the CTO plan, will be offered elevation of the structure if residential, floodproofing if commercial, and voluntary buyout. (PDF pages 246-247)
2023 Alternative C (Non-structural map)
Alternative A1 (nonstructural) map from the 2023 USACE internal presentation obtained via FOIA request. The 2023 draft Alternative A1 plan included 600 structures. The 2024 Alt A1 only includes 143 structures.
*Note the structures along the tributaries that were included in this map of the 2023 Alternative A1 plan. The 2024 USACE DEIS removed "cleanout and maintenance of tributaries" from further consideration for inclusion in CTO plan and also removed structures along the tributaries from inclusion in the Alternative A1 non-structural measures. This reduced the number of structures included in the Alternative A1 plan from 600 to 143. (PDF page 115)
Map created for additional comparison and analysis (*not to be used for planning purposes)
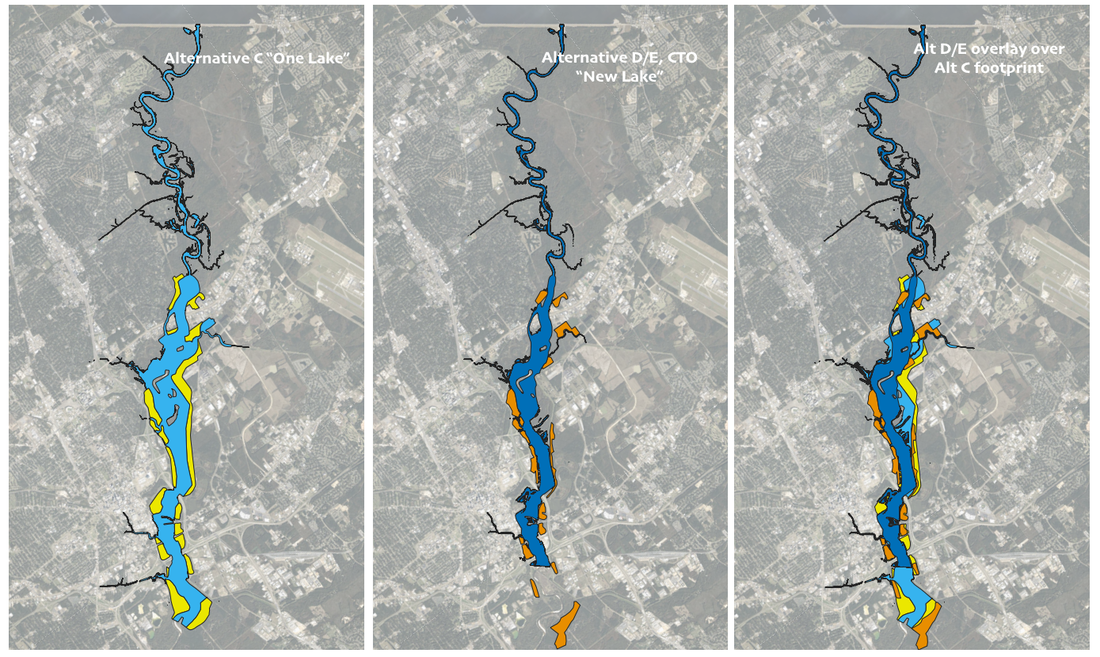
Estimated comparison of the sizes of Alternative C "One Lake" and Alternative D/E "New Lake" based on 2024 USACE DEIS. (*maps are rough estimates and should not be used for legal, engineering, or surveying purposes). Click for PDF.
Map left: Alternative C "One Lake", Map middle: Alternative CTO D/E "New Lake", Map right: Overlay of Alt D/E over Alt C footprint
Map key:
-light blue: areas flooded by Alt C but not Alt D
-dark blue: areas flooded by both Alternatives
-yellow: areas filled by Alt C but not Alt D
-orange: areas filled by Alt C but not Alt D
Map key:
-light blue: areas flooded by Alt C but not Alt D
-dark blue: areas flooded by both Alternatives
-yellow: areas filled by Alt C but not Alt D
-orange: areas filled by Alt C but not Alt D
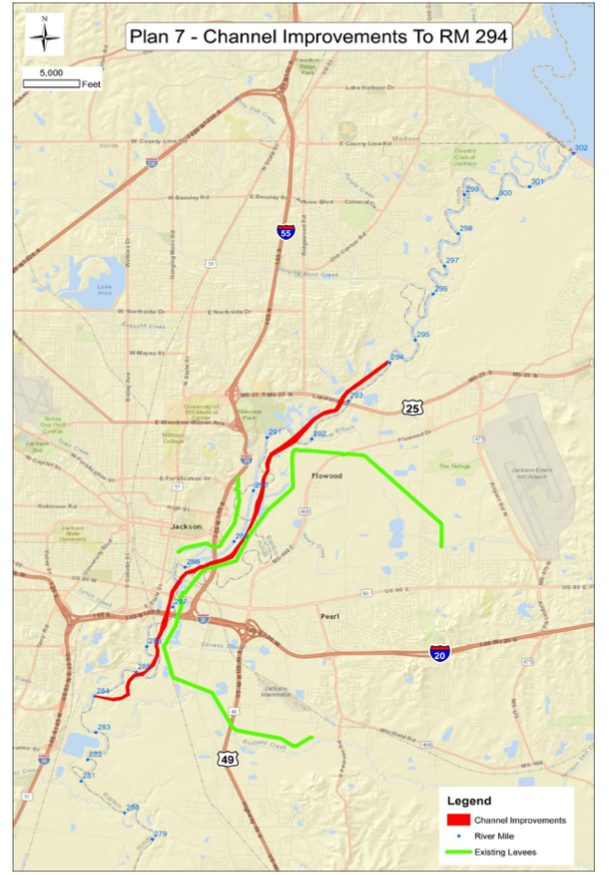
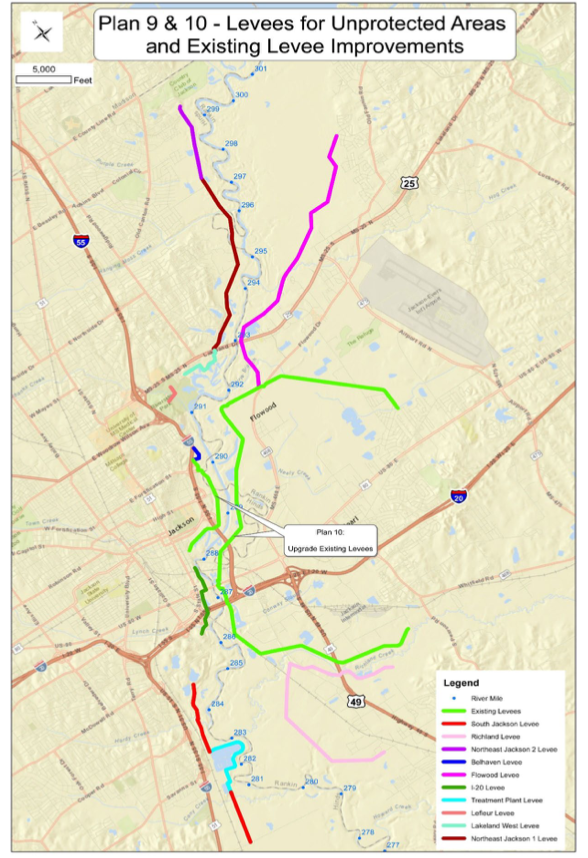
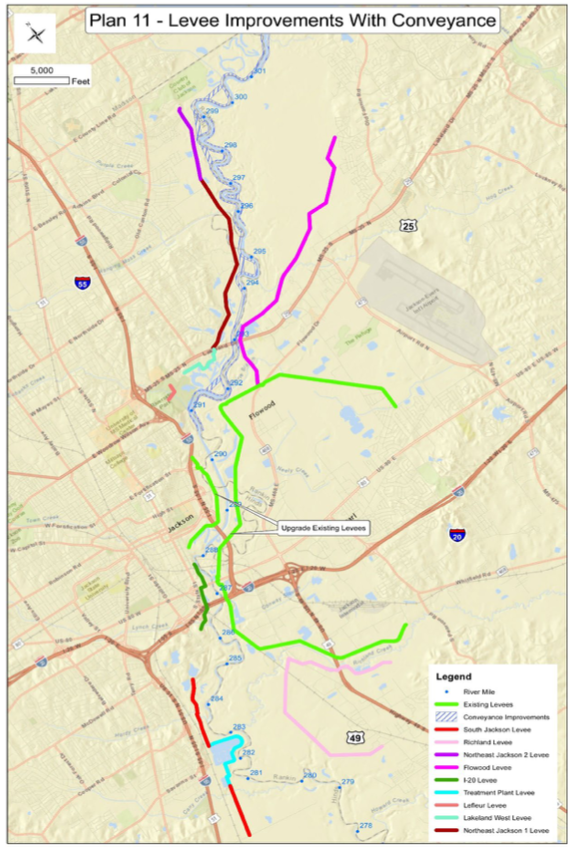
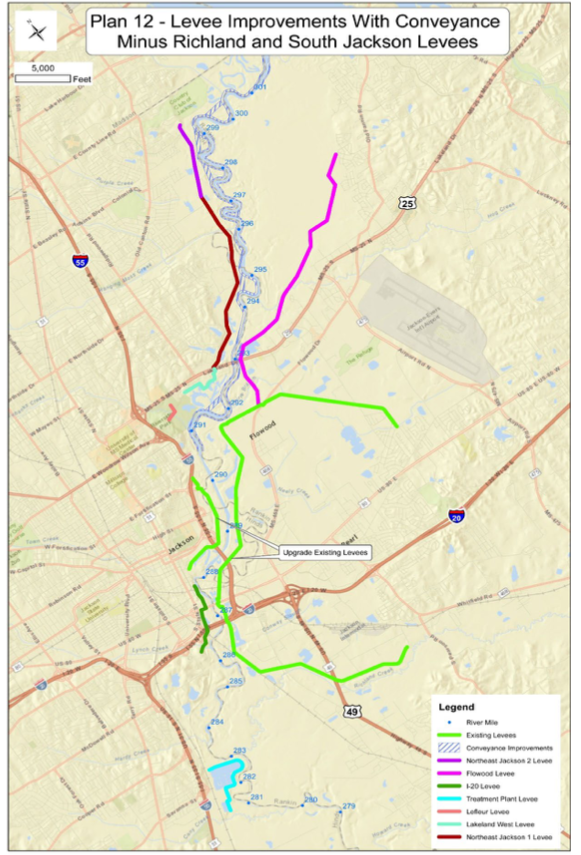
Plan Formulation Maps
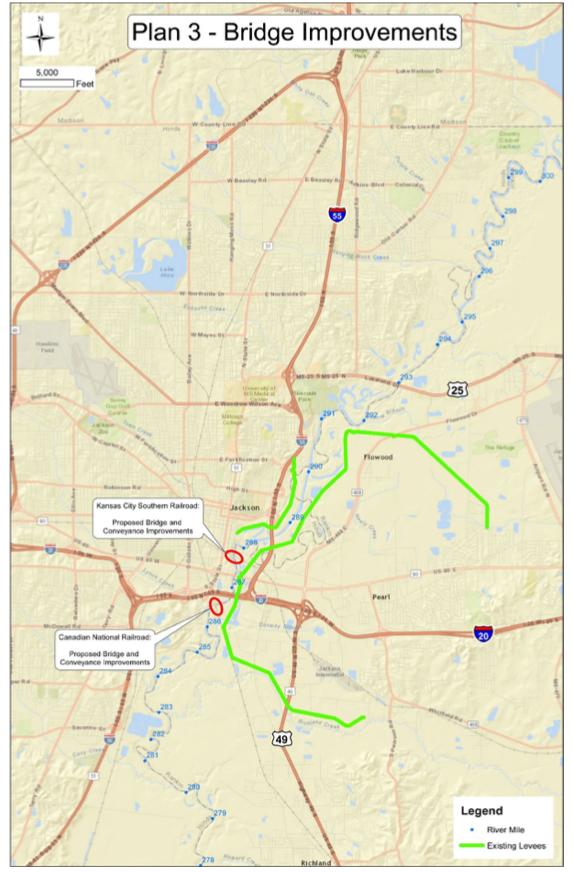
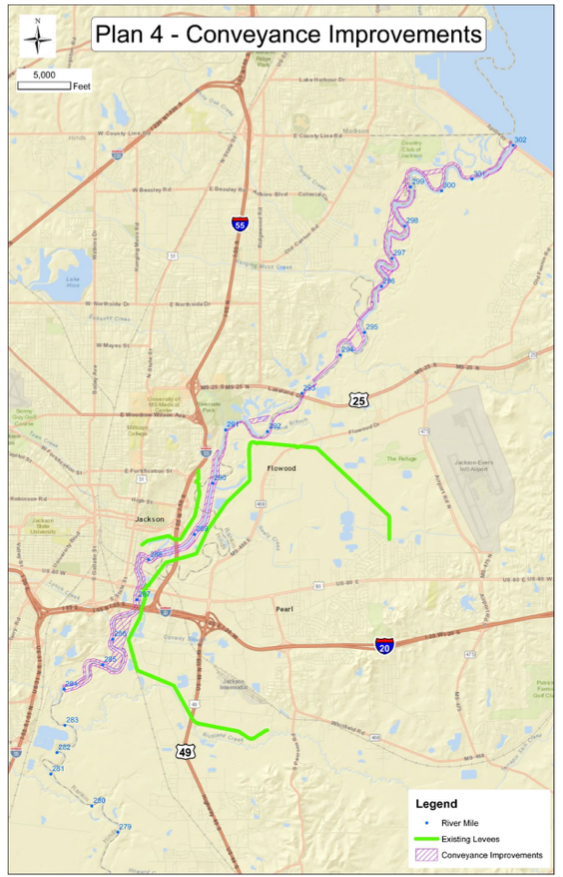
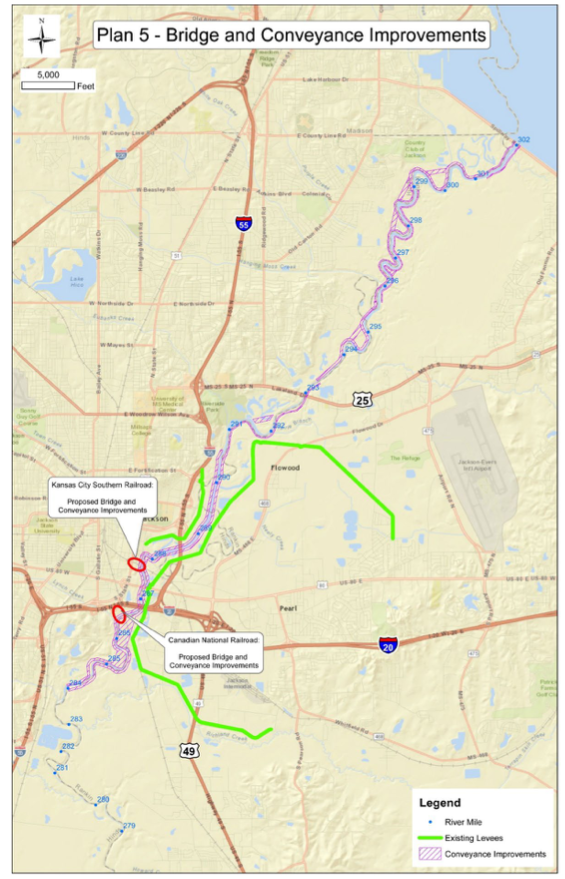
The maps below were included in the 2024 USACE DEIS, Appendix M, Plan Formulation.
All of these plans were rejected by the Rankin Hinds Pearl River Flood and Drainage Control District in favor of "One Lake". Read more about the plans in Appendix M.
All of these plans were rejected by the Rankin Hinds Pearl River Flood and Drainage Control District in favor of "One Lake". Read more about the plans in Appendix M.
|
|
|

|
|
|
|
|
Pearl Riverkeeper asks that everyone make his or her own decision regarding the Pearl River Flood Risk Management Project using sound science and engineering. We encourage the review and thorough analysis of all available information. We welcome comments and feedback. Please email Pearl Riverkeeper or visit our Facebook for comment space. Our publishing, or re-publishing, of anyone else's research or opinions is not an endorsement on our part of those conclusions.